

Application Note 2: Determining (n,m) Compositions of Semiconducting Single-Walled Carbon Nanotubes (SWCNTS) in a Sample using a NanoSpectralyzer
Overview
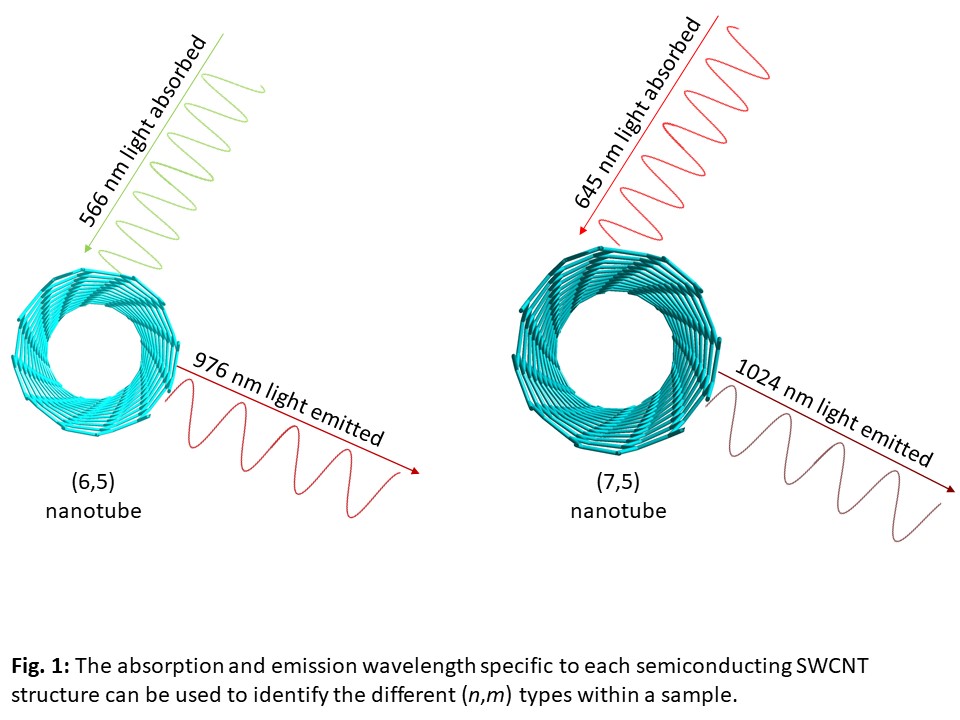
SWCNT samples almost always contain a number of (n,m) structural species, including semiconducting and metallic forms. The semiconducting SWCNT species present in a sample can be detected and identified by their fluorimetric signatures, which involve characteristic emission peaks in the near-infrared (NIR) and characteristic absorption peaks in the visible region. Figure 1 depicts two semiconducting SWCNT structures (denoted by two integers, (n,m)), that have absorption and emission wavelengths specific to each structure.
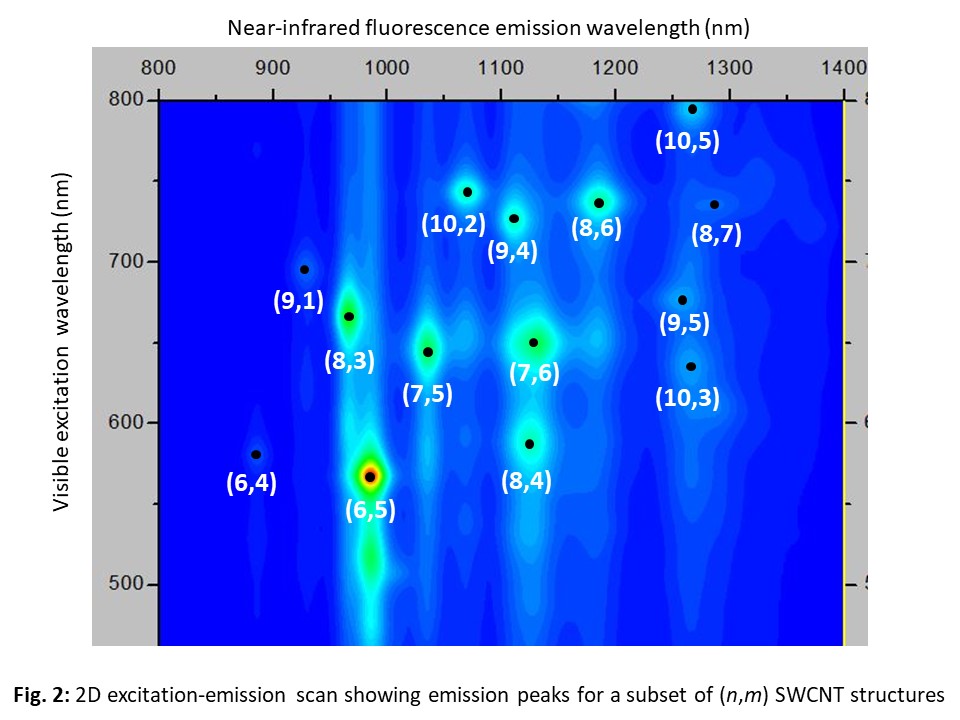
Two-dimensional excitation-emission scans were originally used to observe fluorescence peaks for the different semiconducting SWCNTs, and these features are used to qualitatively analyze the distribution of (n,m) species in a sample. Figure 2 shows a 2D scan with the peak positions labeled with the corresponding (n,m) semiconducting nanotube structure.
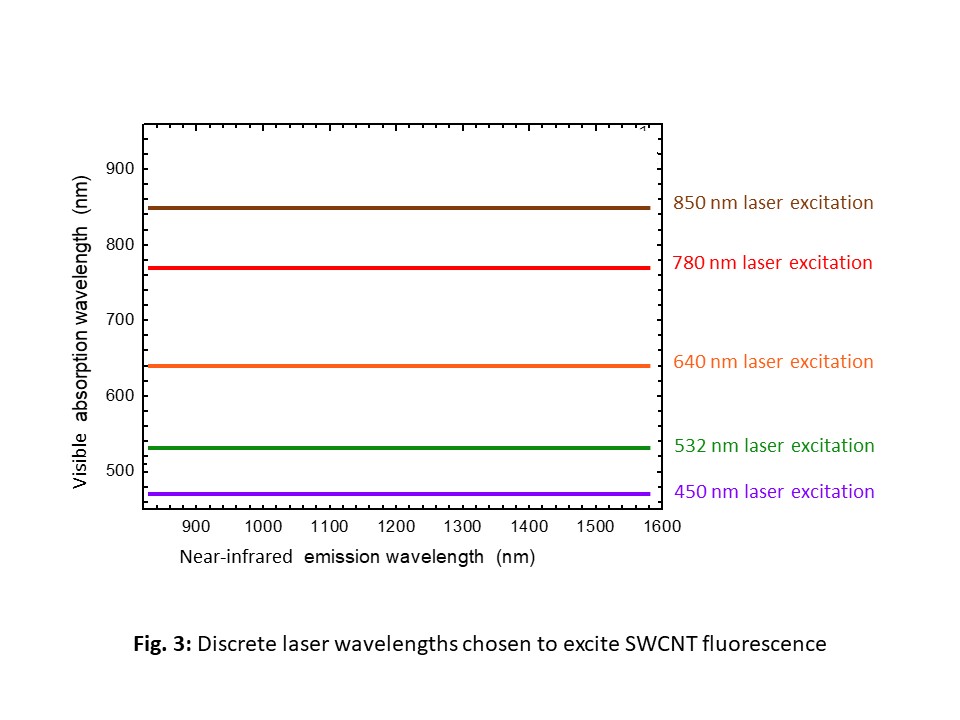
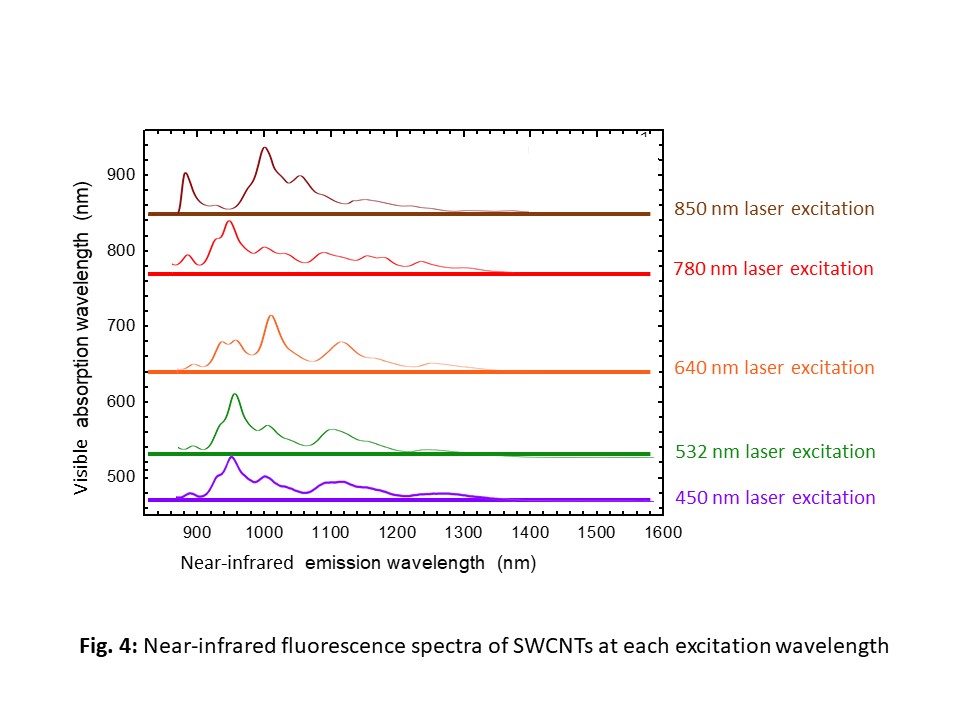
The continuously wavelength-tunable excitation light needed for such scans is available only by using a monochromator to filter the output of a broadband lamp. Unfortunately, the resulting lamp-based excitation beam is low in power and impossible to focus tightly. NanoSpectralyzers instead uses 4 to 5 higher power diode lasers with fixed wavelengths carefully chosen to excite a broad range of semiconducting SWCNTs. But how can many (n,m) species be detected using only 4 or 5 wavelengths that may not match most of their absorption peaks? First, each (n,m) species has a dominant excitation band with broad Lorentzian wings that extend far from the resonance peak. In addition, there are secondary excitation features from vibronic side-bands and perpendicular spectral transitions that greatly expand the range of wavelengths capable of inducing near-infrared emission. Finally the NanoSpectralyzer’s powerful excitation beams, efficient optical system, and sensitive near-infrared detector let it capture emission spectra with very high signal-to-noise ratio and large dynamic range, clearly revealing the emission features of less abundant or inefficiently excited species. Figures 3 & 4 show a typical selection of laser excitation wavelengths and the fluorescence emission obtained using those excitations.
 |
 |
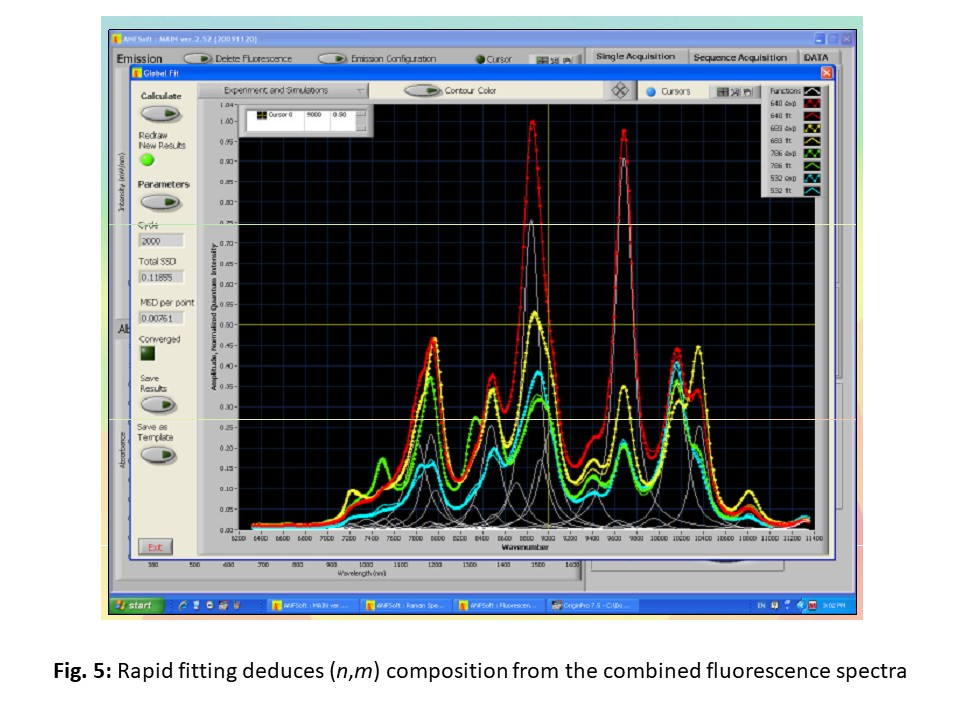
Specialized analysis software integrated with the NanoSpectralyzer automatically uses advanced models of nanotube spectroscopy and photophysics to interpret the data and generate a semiconducting (n,m) inventory of a sample. This analysis takes only seconds, even for very dilute SWCNT samples. There are two levels of sophistication in finding the quantitative distribution of semiconducting (n,m) abundances in a SWCNT sample. The first is measuring and tabulating the near-infrared emission intensities (normalized to excitation efficiency and laser power) of the species identified in the (n,m) inventory described above. The NanoSpectralyze analysis software achieves this by careful global fitting of the emission spectra from all excitation wavelengths (example of a global fit shown in Figure 5).
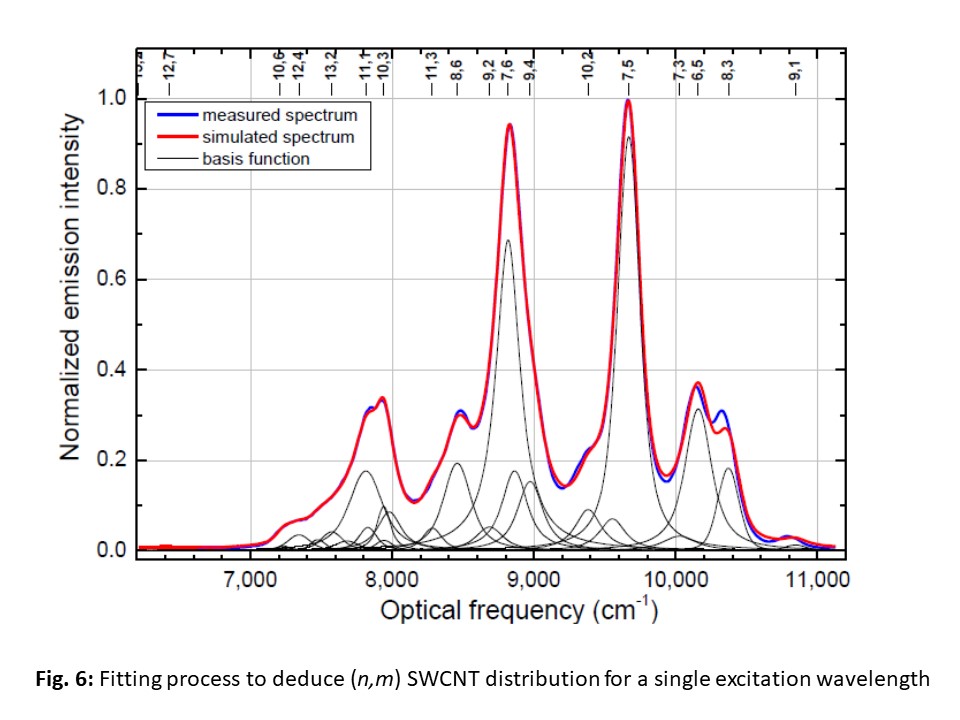
Each spectrum is simulated as a superposition of emission peaks from a large “basis set” of (n,m) species, with the relative species populations constrained to match among all three spectra (a single spectrum with basis functions is displayed in Figure 6). The simulation uses an advanced model that includes precise peak positions, widths, and shapes for each species’ excitation and emission spectrum.
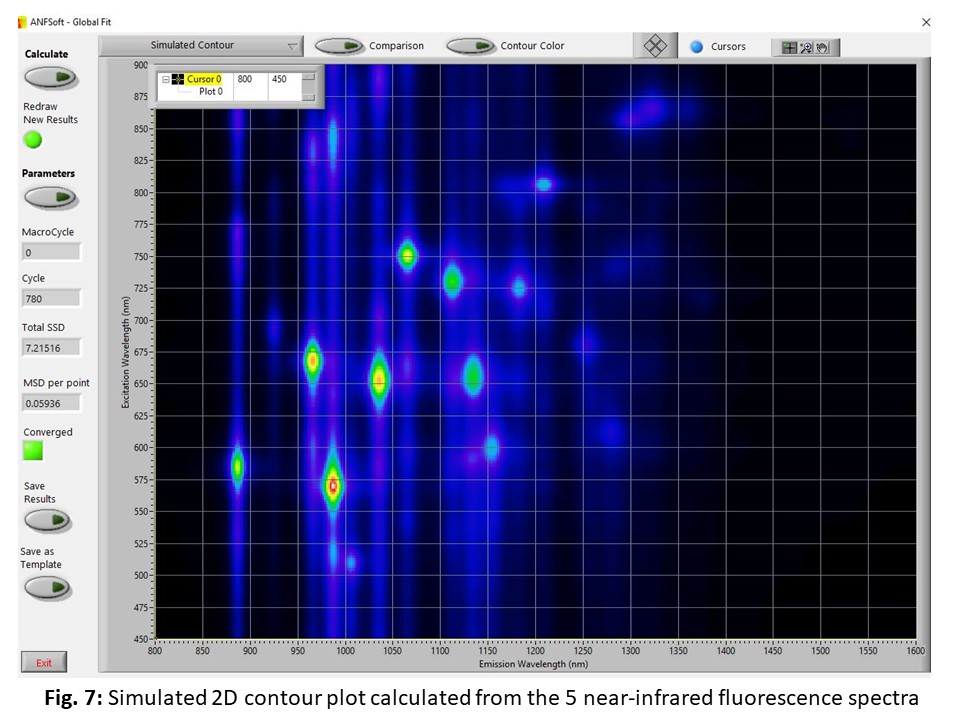
These parameters are held in surfactant-specific templates that reflect the minor spectral changes induced by different nanotube environments (Origin template files can be accessed on the Downloads and Links page under the Resources menu). Instrumental factors such as the wavelengths and powers of the excitation lasers are included to compensate for differences in excitation efficiency among the (n,m) species. Efficient algorithms allow quick computation of the fitting results. They give a distribution equivalent to that obtained from measuring peaks in a two-dimensional excitation-emission scan, but with the advantages of much faster data acquisition and higher sensitivity. In fact, the NanoSpectralyze softare has the ability to simulate the full 2D scan from the flourescence spectra obtained from the individual laser excitations as shown in Figure 7.
 The second level of quantitative interpretation goes beyond the assumption (implied above) that all (n,m) species give equal fluorescence signal strengths if they are present at equal mass concentrations. Instead, the (n,m) distribution deduced from the first level is adjusted using a set of correction factors that reflect the differing intrinsic fluorimetric brightness of different species. These (n,m)-specific factors are the product of absorption cross-section at the excitation peak multiplied by quantum yield for NIR emission. They are found from state-of-the-art calibrated photophysical measurements on individual SWCNTs. As future research findings suggest refinements in these correction factors, they will be promptly updated in revised versions of the NanoSpectralyze software. By applying the photophysical correction factors during fluorimetric analysis, the NanoSpectralyzer system provides a reliable (n,m) distribution showing the relative mass abundances of semiconducting SWCNT species in the sample. No other bulk method can provide such quantitative analyses.
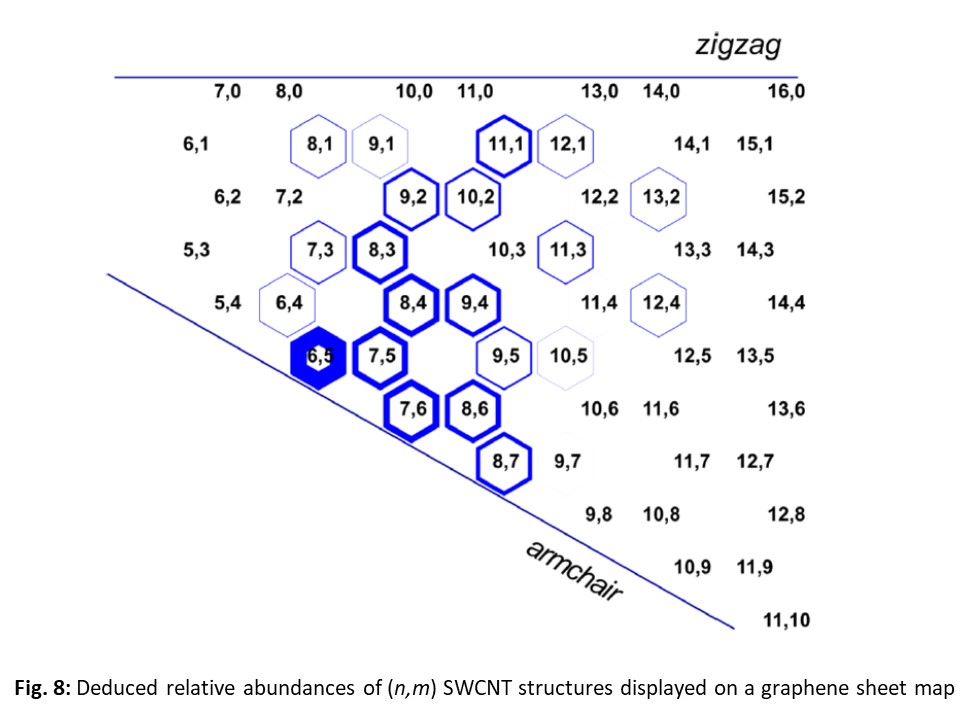
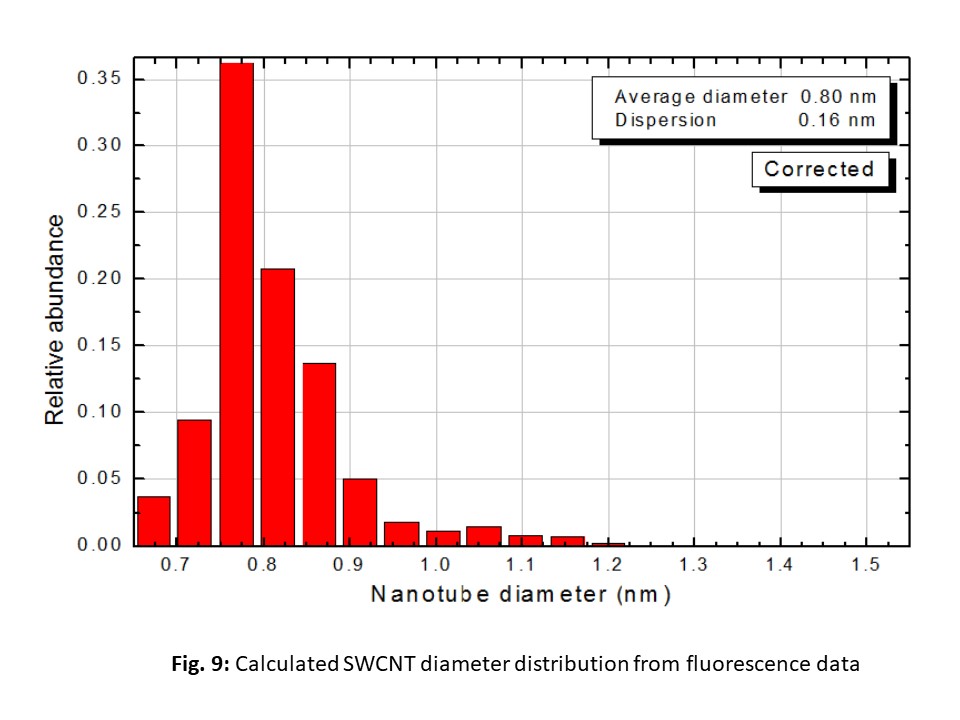
The (n,m) distribution deduced by measuring and interpreting the near-infrared emission spectra is displayed in automatically generated, publication-ready graphs such the graphene sheet map in which the line thickness of each hexagon is proportional to the deduced species abundance shown in Figure 8, and the diameter histogram computed from the abundance distribution shown in Figure 9.
 |
 |
References: Structure-Assigned Optical Spectra of Single-Walled Carbon Nanotubes, S. M. Bachilo et al., Science (2002) 298, 2361, Dependence of Optical Transition Energies on Structure for SWCNT in Aqueous Suspension: An Empirical Katuaura Plot, R. B. Weisman and S. M. Bachilo, Nano Lett. (2003) 3, 1235, Efficient Spectrofluorometric Analysis of SWCNT Samples, J. R. Rocha et al, Analytical Chemistry (2011) 83, 7431, Structure-dependent Fluorescence Efficiencies of Individual SWCNTs, D.A. Tsyboulski et al, Nano Lett (2007) 7, 3080